CS2 Skin Price History: What 22 Days of My Own Data Actually Showed
Heads up: CS2 skins are unregulated digital items, not investments or securities. Prices can fall sharply and Valve can change the rules at any time. Nothing here is financial advice — never spend money you can’t afford to lose.

Sukie · Founder & Market Tracker
Sukie has tracked the Counter-Strike skin economy since 2023, maintaining a price-history spreadsheet that covers 400+ skins and testing every major marketplace with her own inventory. She writes and updates every guide on CS2 Skin Prices herself.
Last updated: 2026-09-05
CS2 skin price history is the most requested and most misused data in this hobby. Everyone wants the chart; almost nobody agrees on what the line represents. Depending on where you pull it from, that line might be a sales-weighted median, a daily closing price, or — most commonly, and most misleadingly — the lowest active listing at the moment somebody happened to sample it. Those are three different quantities with three different failure modes, and treating them interchangeably is how people talk themselves into bad trades.
Rather than describe the problem abstractly, I am going to show you a dataset I recorded myself: the lowest live listing for 56 items, sampled every three days between 31 July and 22 August 2026, nine snapshots in total. It is a short window and I will not pretend otherwise. But it is first-party, it is timestamped, and it contains at least three instructive artefacts that a longer, prettier chart from someone else would have smoothed away.
Three kinds of price history, and why the difference matters
Sales-weighted history records what items actually sold for. This is the most honest measure and the hardest to get, because most marketplaces do not publish completed-sale data. Steam does, in the form of its median sale price chart, which is why that chart is worth more than its ugly presentation suggests.
Listing-floor history records the cheapest thing on offer at sample time. Almost every third-party chart is this. It is easy to collect and it responds instantly to a single seller's behaviour, which makes it noisy in a specific, directional way: it can crash without anything happening and recover just as fast.
Order-book history records the highest standing buy order. This is the floor beneath which nothing trades, and it is the most conservative number available. Very few tools expose it.
My dataset is listing-floor history. I am telling you that up front because it determines which conclusions are safe to draw from it.
There is a fourth thing people call price history that is not history at all: a site showing you a single "suggested price" with no chart behind it. Those figures are usually a blend of recent listings and a fudge factor, they update on an unpublished schedule, and they are the reason two sites can quote the same skin $15 apart on the same afternoon. If you cannot see the series the number came from, you do not have history — you have somebody's opinion with a decimal point.
The headline: 47 of 56 items fell
Across the window, 47 items fell, 9 were flat or up, and the median change was −5.6%. The distribution:
| Movement over 22 days | Items |
|---|---|
| Fell more than 10% | 4 |
| Fell 5–10% | 27 |
| Fell 0–5% | 16 |
| Flat or rose | 9 |
The useful part is not the direction — three weeks of drift proves nothing about a market. It is the coherence. When 84% of a diversified basket moves the same way in the same window, you are looking at something market-wide rather than skin-specific. That distinction is the single most valuable thing price history gives you, and it is invisible if you only track one item.
Blue chips held; the middle of the market did not
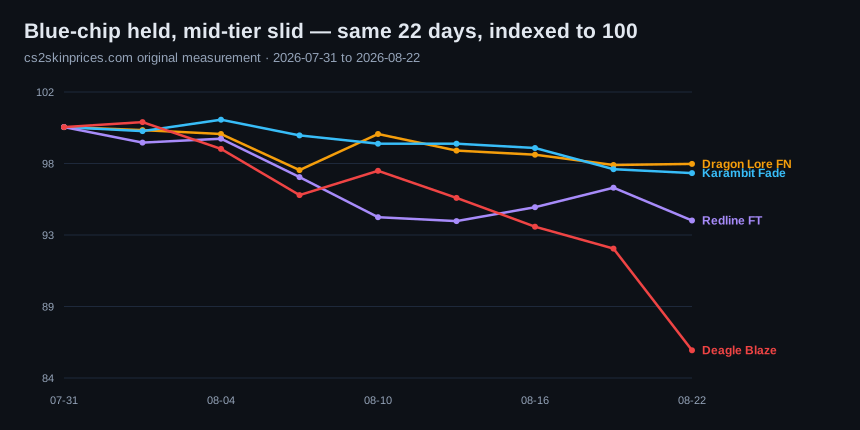
Sorting by size of item produces a clean split.
| Item | 31 Jul | 22 Aug | Change |
|---|---|---|---|
| AWP | Dragon Lore (Minimal Wear) | $8,400.00 | $8,428.40 | +0.3% |
| M4A4 | Howl (Factory New) | $6,515.52 | $6,650.00 | +2.1% |
| AWP | Dragon Lore (Factory New) | $11,500.00 | $11,233.00 | −2.3% |
| ★ Karambit | Fade (Factory New) | $1,869.66 | $1,815.38 | −2.9% |
| AK-47 | Redline (Field-Tested) | $28.52 | $26.84 | −5.9% |
| Desert Eagle | Blaze (Factory New) | $652.99 | $561.12 | −14.1% |
| Kilowatt Case | $0.14 | $0.09 | −33.8% |
Four-figure items barely moved. Mid-tier items fell around the median. Cases fell off a cliff. That ordering is not a coincidence — it is a function of order-book depth, which I come back to below.
Artefact one: the Asiimov that crashed 24% and recovered in three days
AWP | Asiimov (Field-Tested) read $108.02 on 31 July, drifted to $110.69, and then printed $81.67 on 13 August before returning to $104.69 on 16 August. A 24% collapse and a full recovery inside six days.
Nothing happened. One seller listed well below market, my sampler caught the floor while that listing was live, someone bought it, and the floor snapped back to where it had been all along. The item's 22-day change was −2.9%; its 22-day range was 35.5%.
This is the defining weakness of listing-floor history and the reason I record the range alongside the change. If your chart shows a spike that reverses within one or two samples, your first hypothesis should be a single listing, not a market event.
Artefact two: a case with a 141% range that finished flat
The Recoil Case started at $0.27 and ended at $0.27 — dead flat — while swinging across a 141% range in between. At prices under a dollar, a two-cent listing difference is a double-digit percentage move. Percentage change is simply the wrong unit for cheap, high-volume items.
The practical rule I now apply: for anything under about $2, ignore percentages entirely and look at absolute cents. Otherwise cases will dominate every average you compute and every alert you configure. Our CS2 case prices page treats this tier on its own terms.
Artefact three: the 13 August cluster
Three separate items printed their window low on the same sample: Asiimov FT at $81.67, Glock-18 Water Elemental FT at $14.39, and Souvenir Dragon Lore FT at $5,950. All three recovered within one or two samples.
A cluster like this is ambiguous, and I want to model the honest response rather than invent a narrative. It could be a genuine soft afternoon across several venues. It could be my sampler catching an aggregation hiccup. With nine data points I cannot distinguish those, and neither could anyone else. What I did was write it down and flag it — which is what you do with an observation you cannot yet explain.
Resist the urge to attach a cause to every wiggle. Most of them do not have one.
Why order-book depth explains the pattern
The reason cases fell hardest and four-figure knives barely moved comes down to how many buy orders sit beneath the listing floor.
A Dragon Lore has a small number of potential buyers, but the ones who exist are patient, well-capitalised and price-aware. Below the lowest listing sits a stack of standing bids that catches any seller who panics. The floor cannot fall far before it hits one.
A case has thousands of buyers but almost no standing bids, because nobody places a limit order for a nine-cent item. When drop supply outpaces demand, there is nothing underneath and the floor slides freely.
Mid-tier skins sit between the two, which is exactly where they landed in the data.
This is also why the same percentage move means different things at different price points. A case losing a third of its value is an ordinary week; a Dragon Lore losing a third of its value would be the biggest story the skin market has had in years. When you read someone reporting that "skins are down 30%", the first question is always: down 30% on what, and how deep was the book underneath it?
The corollary for anyone holding inventory is uncomfortable but worth internalising. Depth is what you are actually buying when you pay up for a blue-chip item — not just the design or the rarity, but the existence of patient buyers underneath your position. Cheap inventory has no such floor, which is why a portfolio of twenty $30 skins is not a diversified version of one $600 skin. It is a concentrated bet on the thinnest part of the market.
Where to get longer history than mine
Twenty-two days is a sample, not a record. For real history:
- Steam's own median sale chart. On any Steam Community Market listing page, the chart above the listings shows median sale price and volume going back years. It is sales-weighted, which makes it the most trustworthy free source, and the volume bars tell you whether a price point was real or a single trade.
- Third-party aggregators. Useful for cross-venue comparison; nearly all are listing-floor based, so apply the artefact scepticism above.
- Your own log. The only source guaranteed to cover the exact items you care about, at a cadence you control. Our CS2 skin price tracker page has the build.
Five rules for reading any CS2 price chart
- Establish what the line is. Sales-weighted, listing floor, or bid. If the source does not say, assume listing floor and discount accordingly.
- Check volume before believing a price. A price point backed by one sale is an anecdote.
- Compare against a basket. A skin down 6% while the market is down 5.6% has done nothing.
- Read the range, not just the endpoints. The Asiimov's −2.9% change hid a 35.5% range.
- Distrust any spike that reverses within two samples. That is a listing, not a market.
What price history genuinely cannot do
It cannot forecast. CS2 prices are set inside a market whose supply is controlled by a single company that does not pre-announce its decisions. Case removals, drop-pool changes, operation launches and rarity adjustments all land without warning and all reprice large parts of the market overnight. No amount of trailing data contains them.
What history does do well is protect you from your own reactions: it tells you whether today is unusual, it separates a skin-specific problem from a market-wide one, and it stops you selling into an artefact. That is a smaller promise than most charts imply, and it is worth more. Our page on CS2 skin price prediction takes the forecasting question head-on, and why CS2 skin prices drop covers the recurring causes.
Methodology, so you can check me
Items: 56 skins, knives, gloves and cases, selected before the window began and unchanged throughout — no survivorship filtering. Measure: lowest live listing across the marketplaces we aggregate, per item, per snapshot. Cadence: every three days, nine snapshots, 31 July to 22 August 2026. Storage: append-only, one row per item per snapshot. Changes quoted are first snapshot to last; ranges are window high against window low.
Known limitations, stated plainly: listing-floor data is vulnerable to single-seller artefacts (three documented above); 22 days is too short to establish a trend; a 56-item basket is not the CS2 market, it is a curated slice weighted toward popular items; and prices are USD lowest-listing, not sales-weighted. Current figures for every item in the set are on the live price checker, and the wider context is in the August 2026 market report. If you would rather start from the beginning, the homepage has the live board and the guide index.
Frequently asked questions
Where can I see CS2 skin price history for free?
Steam Community Market publishes a median sale price and volume chart on every listing page, going back years — it is sales-weighted and free, which makes it the best free source despite the plain presentation. Third-party aggregators offer cross-venue charts, but nearly all of those track the lowest listing rather than actual sales.
Why does CS2 price history show crashes that never really happened?
Most charts track the lowest active listing rather than completed sales, so a single seller pricing far below market drags the line down until that listing is bought. In my own 22-day dataset an AWP Asiimov appeared to fall 24% and fully recovered within six days, with no market event behind it.