CS2 Skin Price Prediction: Why Every Forecast Fails, and What to Do Instead
Heads up: CS2 skins are unregulated digital items, not investments or securities. Prices can fall sharply and Valve can change the rules at any time. Nothing here is financial advice — never spend money you can’t afford to lose.

Sukie · Founder & Market Tracker
Sukie has tracked the Counter-Strike skin economy since 2023, maintaining a price-history spreadsheet that covers 400+ skins and testing every major marketplace with her own inventory. She writes and updates every guide on CS2 Skin Prices herself.
Last updated: 2026-09-20
Every CS2 skin price prediction you will ever read has the same fatal flaw, and it is not that the author is careless. It is that the single largest determinant of skin prices — what Valve decides to do with supply — is unannounced, unscheduled, and unknowable from outside the company. A case removal, a drop-pool change, a rarity adjustment or an operation launch can reprice large parts of the market overnight, and no amount of trailing price data contains that information in advance.
I want to be useful rather than merely sceptical, so this page does three things: explains precisely which forces are predictable and which are not, shows what my own data says about the limits of short-window inference, and then offers the framework I actually use — which is about sizing and structure rather than forecasting. Nothing here is financial advice, and the risk note at the top of this page is not decoration.
The five forces that move skin prices, ranked by predictability
1. Supply decisions by Valve — completely unpredictable. Case removals from the active drop pool, changes to what drops and how often, discontinuation of containers, adjustments to trade-up outputs. These are announced, if at all, at the moment they take effect. They are also the largest single driver of long-term value. Anyone forecasting past this is forecasting past the main variable.
Valve publishes patch notes for Counter-Strike at the official update feed, and reading it is the closest anyone outside the company gets to advance warning — which is to say, no advance warning at all, since supply changes appear there at the moment they ship.
2. Player-base cycles — partly predictable in direction, not in magnitude. Major tournaments, operation launches and seasonal patterns reliably increase engagement and, with it, demand. That the effect exists is knowable; how large it will be is not.
3. Broader market sentiment — observable in hindsight only. The skin market has cycles that look obvious afterwards and are invisible while you are in them. My own 22-day sample showed 47 of 56 items falling with a median of −5.6%, which reads as a clear downtrend — and 22 days is far too short to know whether it was one.
4. Item-specific supply mechanics — genuinely predictable, and the only real edge available. If a collection has left the drop pool, its supply can only shrink from here as copies are consumed by trade-ups and inactive accounts. That is an arithmetic certainty, not a forecast. What it does not tell you is timing or magnitude.
5. Individual listing noise — predictable in character, not in occurrence. You can be certain artefacts will happen; you cannot know when. My tracker caught an AWP Asiimov apparently falling 26% and fully recovering in six days on a single cheap listing.
Only category four gives you anything actionable, and what it gives you is a structural argument rather than a price target.
What my own short window actually proved: very little
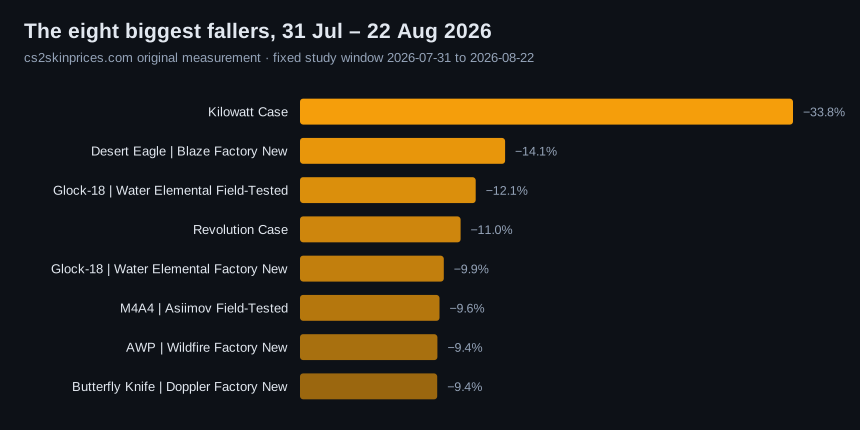
Between 31 July and 22 August 2026 I recorded lowest live listings for 56 items every three days. The results looked decisive: 47 down, 9 flat or up, median −5.6%, with cases hit hardest and four-figure items nearly unmoved.
Here is the honest reading of that. Twenty-two days and nine snapshots is enough to observe a coherent move and nowhere near enough to establish a trend, let alone project one. Three of my items printed their window low on the same sample — 13 August — and all three recovered within one or two snapshots. If I had built a forecast on the 13 August reading I would have been wrong about all three within a week.
The methodological point generalises. Short windows produce confident-looking datasets, and confidence is the failure mode. Anyone showing you a prediction built on a few weeks of listing-floor data is showing you noise with a trendline through it. The full dataset and its artefacts are documented on our CS2 skin price history page.
Why technical analysis does not transfer to this market
Chart patterns borrowed from equities and crypto get applied to skin prices constantly, and the transfer does not work for three structural reasons.
There is no continuous order book on most venues. Charts you see are usually lowest-listing series, not sales. Patterns drawn on a listing floor are patterns drawn on seller behaviour.
Volume is thin and lumpy. A four-figure item might trade a handful of times a month. Indicators that assume continuous liquidity produce nonsense on data like that.
Supply is administered, not market-determined. In a normal market, high prices induce supply. Here, supply is a policy decision by one company. The feedback loop that most technical analysis implicitly assumes simply does not exist.
None of this means charts are useless — reading history properly is genuinely valuable. It means the specific practice of extrapolating patterns forward has no mechanism behind it here.
The one structural argument that does hold
Frozen supply plus persistent demand equals upward pressure over long horizons. That is not a prediction; it is arithmetic about a shrinking population.
The qualifications matter enormously, though. Frozen supply is necessary but nowhere near sufficient — plenty of retired skins are retired because nobody wanted them, and their supply shrinks while their price does nothing. Demand has to persist, which means the design has to remain wanted, which is a taste question nobody can model. And the horizon is years, during which the item is illiquid and can fall substantially.
My own data illustrates the ambiguity nicely. The AWP Dragon Lore, the most supply-constrained famous item in the game, fell 2.3% in Factory New over the window while rising 0.3% in Minimal Wear. Structural scarcity did not produce a rise; it produced stability while the rest of the market slid. That is what the argument actually buys you — resilience, not appreciation.
The three prediction methods people actually use, and where each breaks
Worth naming them, because each fails differently and knowing which one you are reading tells you how to discount it.
Trend extrapolation. Draw a line through recent prices and extend it. Breaks because listing-floor series are dominated by artefacts — my AWP Asiimov would have produced a violently bearish line on 13 August and a violently bullish one on 16 August, from the same underlying market doing nothing.
Supply-side reasoning. Argue from scarcity: this collection is retired, therefore up. The logic is sound and the timing is unknowable. Items can stay flat or fall for years while their supply slowly shrinks, and 'eventually' is not a plan you can size a position around.
Comparable analysis. Point at a similar skin that appreciated and infer this one will follow. Breaks on selection bias — the comparable is chosen because it appreciated, and the dozens of similar skins that did not are invisible to the argument. This is the most persuasive method and the least reliable, because it always comes with a compelling story attached.
If a forecast does not fit one of these three, it is usually a fourth thing: someone's feeling, formatted as analysis.
Questions worth asking instead of 'what will this be worth'
Five that have a knowable answer, unlike the forecast:
- Is this item's supply still growing? Knowable. Check whether the case or collection is still in the active drop pool. Our CS2 case prices page shows what active supply does — the Kilowatt Case fell 33.8% in three weeks while discontinued cases were flat.
- How deep is the book beneath the listing? Partly knowable via Steam's sale-volume bars. Depth is what stops a price falling.
- Would I still want this if the price halved? Entirely knowable, and the single best filter there is.
- How long would it take me to sell? Estimable from listing turnover. For thin items the honest answer is weeks.
- What fraction of my position is one item? Knowable, and usually higher than people think.
How I actually size positions
Three rules, all of them about survival rather than selection.
Assume a 30% drawdown is normal. Not a disaster scenario — a normal one. If a 30% fall would change your behaviour, the position is too large.
Never hold anything you would need to sell quickly. Skin liquidity evaporates precisely when you want it. The item you can sell in an hour is the one nobody wants to buy at a good price.
Size cheap items smaller than the maths suggests. Counter-intuitive but supported by my data: cheap items are the most volatile by percentage and the least cushioned, because nobody places standing bids on a nine-cent case. A basket of twenty $30 skins is not a safer version of one $600 skin.
The build for tracking any of this is on our CS2 skin price tracker page, and the column layout on the investment spreadsheet.
Red flags in any prediction you read
A specific price with a specific date. A percentage return with no stated horizon. Any claim to know Valve's roadmap. Extrapolation from under three months of data. Charts without a stated source or a stated measure — listing floor, median sale, or bid. Confident language about a market whose main variable is a private company's unannounced decisions.
And the most common one: a forecast that only works if you buy something the author is selling, holding, or affiliated with. We run no affiliate links and hold no positions in the items on this site, which is stated in our editorial policy — the reason to say so is that it is the first thing you should check on anyone else's forecast too.
What I will commit to saying
Three statements I am comfortable defending, none of which is a price target.
Items whose supply has permanently stopped growing have a structural advantage over items whose supply is still expanding. The mechanism is arithmetic and my own data supports the direction — discontinued cases flat, active-pool case down 33.8%.
Short-term skin price movements are dominated by noise, and most of what looks like signal in a few weeks of data is not. Three of my 56 items printed false lows on a single sample.
The dispersion between blue-chip and mid-tier items is real and persistent, driven by order-book depth rather than by anything about the skins. Over my window, four-figure items moved 0–3% while mid-tier items moved 6–14%.
That is genuinely the extent of what the evidence supports. Anyone offering more from the same kind of data is offering confidence rather than information. For the broader picture, our investing hub and the piece on why CS2 skin prices drop cover the mechanics, and the market value page covers sizing the economy honestly.
A closing caution
CS2 skins are virtual items in a market controlled by one company, with no consumer protection, no regulatory floor and no obligation on anyone to maintain their value. Prices can and do fall a long way. Money that matters to you does not belong here, and no framework on this page changes that — including the parts I think are correct.
If you want current figures rather than forecasts, the live price checker carries lowest listings across major marketplaces with a visible fetch date, and the homepage has the live board and the full guide index.