CS2 Skin Price Tracker: How I Built One That Actually Caught the August Slide
Heads up: CS2 skins are unregulated digital items, not investments or securities. Prices can fall sharply and Valve can change the rules at any time. Nothing here is financial advice — never spend money you can’t afford to lose.

Sukie · Founder & Market Tracker
Sukie has tracked the Counter-Strike skin economy since 2023, maintaining a price-history spreadsheet that covers 400+ skins and testing every major marketplace with her own inventory. She writes and updates every guide on CS2 Skin Prices herself.
Last updated: 2026-08-31
I built my first CS2 skin price tracker because I got burned. In 2023 I sold an AWP Asiimov on a day the lowest listing happened to be sitting 22% below where it had been all week, convinced myself the market had turned, and watched it recover inside three days. I had no history to check against — just the number on my screen at that moment. A price tracker is not a price checker. A checker tells you what something costs right now; a tracker tells you whether that number is normal.
That difference is the entire point of this page. Below is the exact setup I run today, the 22-day dataset it produced across 56 items between 31 July and 22 August 2026, and — more usefully — the four design mistakes that make most home-built trackers worse than useless. If you only want the current number, our live CS2 skin price checker already does that job and you can stop reading.
What a tracker has to do that a checker does not
A price checker answers one question: what is the lowest listing right now? That is a snapshot, and snapshots lie in three specific ways.
They report a floor, not a value. The lowest listing is one seller's asking price. One person listing well below market — because they need cash, or because they mispriced a high-float copy — drags the number you see without moving the market at all.
They have no memory. Without history you cannot tell a 5% dip from a 5% collapse, because you do not know the range. Every number looks equally meaningful in isolation.
They flatten the spread. A single figure hides the fact that the same skin might be $104 on one venue and $118 on another, which is often where the actual opportunity is.
A tracker fixes all three by doing one boring thing consistently: writing the number down, with a timestamp, on a schedule, forever. Everything else is decoration.
The build I run has four parts, and it costs nothing:
- A fixed watchlist. Specific items, specific wear tiers, named exactly as the marketplace names them. Not "AK Redline" —
AK-47 | Redline (Field-Tested). Ambiguity here poisons everything downstream. - A scheduled fetch. Mine runs every three days against a marketplace aggregation API. Every three days is deliberate; more on that below.
- Append-only storage. Each run appends a dated row. It never overwrites. The history is the product.
- A diff step. After each run, compare against the last one and the 30-day range, and flag anything outside it.
For a free sales-weighted reference to check your own numbers against, every listing page on the Steam Community Market carries a median sale price and volume chart going back years — it is the only widely available series based on completed sales rather than listings.
If you would rather do this in a spreadsheet than in code, the column layout I use is on our CS2 skin investment spreadsheet page — same logic, no scripting.
What my tracker actually recorded, 31 July to 22 August 2026
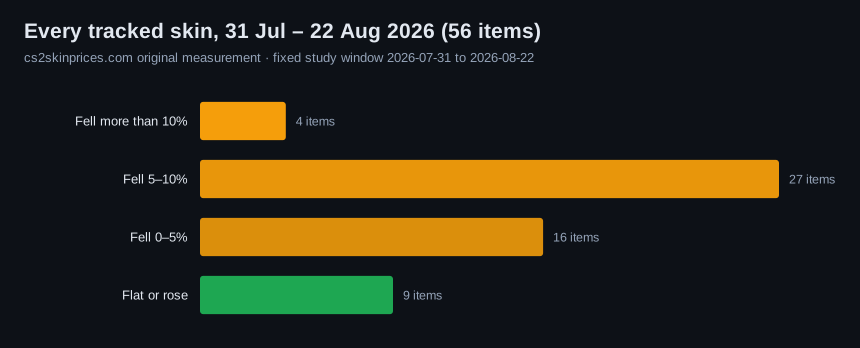
Here is the payoff for keeping history. Across 56 tracked items over nine snapshots in 22 days:
| Movement | Items | Share |
|---|---|---|
| Fell more than 10% | 4 | 7% |
| Fell 5–10% | 27 | 48% |
| Fell 0–5% | 16 | 29% |
| Flat or rose | 9 | 16% |
Median change across the whole set: −5.6%. Forty-seven of fifty-six items were down. If you had checked a single skin on 22 August and seen it 6% lower than you remembered, you might have read that as a problem with that skin. It was not — it was the whole tracked basket moving together, which is a completely different signal and calls for a completely different response.
The spread within that slide is where it gets interesting. The four worst performers were a case (Kilowatt, −33.8%), a Factory New Desert Eagle Blaze (−14.1%), a Field-Tested Glock Water Elemental (−12.1%) and the Revolution Case (−11.0%). Meanwhile the AWP Dragon Lore in Factory New fell 2.3% and in Minimal Wear actually rose 0.3%. Four-figure blue-chip items barely moved; mid-tier and case inventory took the hit.
I would not have seen any of that from a price checker. I saw it because the tracker had nine rows instead of one.
The four traps that ruin home-built trackers
Trap 1: polling too often. This feels like the obvious way to get better data and it is the opposite. Sampling hourly gives you a dataset dominated by listing churn — someone lists, someone buys, the floor jumps around — and you end up reacting to noise. Every three days is enough to see a trend and not enough to see the jitter. It also keeps you inside the free tier of every API worth using.
Trap 2: tracking the lowest listing and calling it the price. My own data contains a perfect example. AWP Asiimov (Field-Tested) read $108.02 on 31 July, $81.67 on 13 August, and $104.69 three days later. That is a 24% crash and a full recovery inside six days. Nothing happened to the Asiimov market. One cheap listing appeared, someone bought it, and the floor snapped back. If your tracker had alerted you on 13 August you would have made a decision on an artefact.
The fix is to record the lowest listing and a second reference — median of the first five listings works well — so you can see when the two diverge. Divergence means the floor is one seller, not the market.
Trap 3: no wear tier in the key. "AK-47 Redline" is not a tracked item. In my own dataset Redline Minimal Wear sits at $119.34 while Field-Tested sits at $24.80 — a 4.81× difference for what a sloppy watchlist would treat as one row. Always key on the full market hash name including the parenthesised wear.
Trap 4: overwriting instead of appending. The single most common failure. A tracker that stores "current price" is a checker with extra steps. Append. Always append. Storage is free and you cannot reconstruct history you never wrote down.
Reading your own data without fooling yourself
Once you have a few weeks of rows, three habits turn the data into decisions.
Compare against the basket, not against zero. A skin down 6% in a month when the basket is down 5.6% has done nothing unusual. A skin down 6% when the basket is flat has a story behind it worth investigating. This single reframing prevents most panic selling.
Watch the range, not the last tick. For each item I keep the high and low of the trailing window. The Recoil Case in my set showed a 141% range while finishing exactly flat — a number that tells you the listing floor on cheap cases is essentially random and should never trigger an alert.
Write down why you think something moved, at the time. Prices react to case removals, operation launches, esports events and update patch notes, and you will not remember which was which six weeks later. A one-line note per snapshot costs nothing and makes the dataset genuinely yours. For the market-wide context behind these swings, our why CS2 skin prices drop page covers the four recurring causes, and the current cycle is summarised in the August 2026 market report.
One last honest note. A tracker tells you what happened. It does not tell you what happens next, and anyone selling you a tracker on that promise is selling something else. Skin prices are driven by a game publisher's unannounced decisions about supply, and no amount of history predicts those. Track to avoid mistakes, not to find certainties — and read our take on CS2 skin price prediction before you trust any forecast, including your own. If you are just getting started, the homepage has the live board and the beginner path.
Frequently asked questions
What is the difference between a CS2 skin price tracker and a price checker?
A checker reports the current lowest listing. A tracker records that number on a schedule and keeps the history, so you can tell whether today's price is normal, high or low for that item. Only the tracker can answer 'is this a good time to buy'.
How often should a CS2 skin price tracker refresh?
Every one to three days is the useful range for most people. Hourly polling produces a dataset dominated by listing churn rather than real price movement, and it burns through API rate limits for no analytical gain.
Can I build a CS2 skin price tracker in Google Sheets?
Yes, and for most people that is the right choice. You need one row per item per date, keyed on the full market hash name including the wear tier, appended rather than overwritten. The column layout is on our skin investment spreadsheet page.
Why did my tracker show a huge price drop that reversed days later?
You almost certainly recorded a listing-floor artefact rather than a market move. One seller listing far below market drags the lowest price without changing what the item actually trades for. Recording a median alongside the minimum lets you spot this.
Does a price tracker need to include the wear tier?
Absolutely. The same skin in different wears can differ by several multiples — AK-47 Redline sat at $119.34 Minimal Wear against $24.80 Field-Tested in my dataset. A watchlist without wear tiers produces meaningless averages.
Which marketplaces should a tracker cover?
At minimum Steam Community Market plus two third-party venues, because Steam's fees create a persistent premium that makes it a poor sole reference. Our marketplace comparison covers the fee structures that drive those gaps.
Is tracking CS2 skin prices against Steam's rules?
Reading publicly listed prices for personal use is normal and widely done. Automated scraping at high frequency can trip rate limiting and is discouraged; using a marketplace's published API within its documented limits is the safe route.
How much price history do I need before the data is useful?
Around three to four weeks gives you a usable range for each item. Below two weeks you cannot distinguish a trend from noise, and any alerting you build will fire on artefacts.
Should a tracker alert me on price drops?
Only on drops that are large relative to that item's own trailing range, and only when the basket is not moving the same way. Absolute-threshold alerts fire constantly on cheap items and never on expensive ones.
Can a price tracker predict future CS2 skin prices?
No. Skin prices respond to unannounced publisher decisions about supply — case removals, drop-pool changes, operation launches — that no historical dataset contains in advance. A tracker prevents mistakes; it does not forecast.
What did your tracker record for the CS2 market in August 2026?
Across 56 items over 22 days, 47 fell and 9 were flat or up, with a median change of −5.6%. Cases and mid-tier skins fell hardest; four-figure blue-chip items like the Dragon Lore barely moved.
Do I need to track cases separately from skins?
It helps. Case prices behave differently — they are cheap, high-volume and dominated by drop supply, which makes their percentage swings enormous and mostly meaningless. Keeping them in a separate view stops them distorting your basket average.