CS2 Skin Market Report: August 2026
Heads up: CS2 skins are unregulated digital items, not investments or securities. Prices can fall sharply and Valve can change the rules at any time. Nothing here is financial advice — never spend money you can’t afford to lose.

Sukie · Founder & Market Tracker
Sukie has tracked the Counter-Strike skin economy since 2023, maintaining a price-history spreadsheet that covers 400+ skins and testing every major marketplace with her own inventory. She writes and updates every guide on CS2 Skin Prices herself.
Last updated: 2026-10-14
This CS2 skin market report covers August 2026 using one dataset I can show you in full: the 56 items this site has priced automatically since 31 July 2026, with a lowest-listing snapshot roughly every three days. Over the 22 days from 31 July to 22 August, 47 of those 56 items got cheaper and the median item fell 5.6%. Expensive items barely moved, mid-priced items fell almost without exception, and cheap cases were the most erratic. Below is that result by category, by price level, by how jumpy each group was, and by how far apart the marketplaces priced the same item. It ends with the watchlist I wrote for the autumn.
Follow-up: the October 2026 report picks up where this one ends and grades the watchlist below.
Updated 14 October 2026. I rewrote this report. The first version leaned on a long-term spreadsheet history, a spring report and third-party market-size figures that I could not back up with anything published on this site. The last section lists exactly what was removed and why. Every number now on the page comes from the site's own price snapshots for this window.
The 22-Day Result
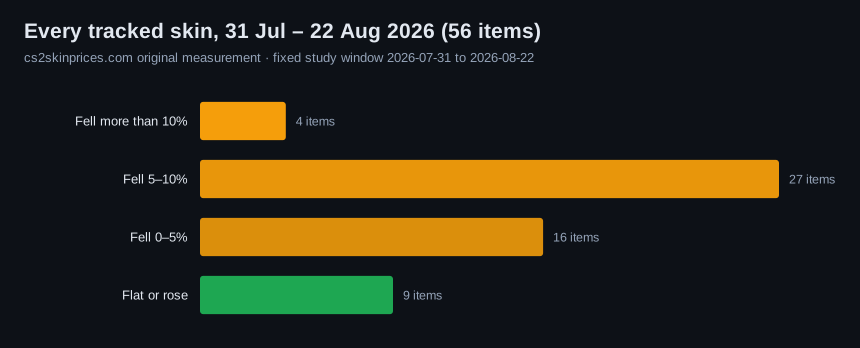
Here is the whole window in one view. Each item's change is its lowest listing on 22 August against its lowest listing on 31 July, across the marketplaces the feed returned (CSFloat, Skinport, CS.MONEY and market.csgo at the time).
| Movement over 22 days | Items |
|---|---|
| Fell more than 10% | 4 |
| Fell 5–10% | 27 |
| Fell 0–5% | 16 |
| Flat or rose | 9 |
| Median change | −5.6% |
The size of the move matters less than how uniform it was. A median of −5.6% with 47 of 56 items lower means the drift was broad: 84% of a basket that spans $0.10 cases and $11,000 rifles moved the same way in the same three weeks. When that many unrelated items fall together, the likeliest cause is something market-wide: fewer buyers, more sellers, or both. A problem with any single skin would not move the whole basket. Nine data points per item cannot tell me which, and I am not going to pretend otherwise.
Three weeks is also short. I would not call this a trend on its own. What makes it worth writing down is that it gives the next report a fixed baseline to compare against, which is exactly how the October report used it.
Category by Category
Every category except cases had a median fall between 4% and 7%. Cases had the smallest median move and the largest single drop, which tells you medians and averages describe cases badly.
| Category | Items | Median, 31 Jul → 22 Aug | Items that fell | Worst item |
|---|---|---|---|---|
| Gloves | 3 | −7.0% | 3 of 3 | −8.5% |
| Pistols | 8 | −6.5% | 7 of 8 | −14.1% (Desert Eagle Blaze FN) |
| Rifles (AK-47, M4A4, M4A1-S) | 17 | −6.0% | 15 of 17 | −9.6% |
| AWP | 12 | −4.2% | 10 of 12 | −9.4% |
| Knives | 8 | −4.1% | 7 of 8 | −9.4% |
| Cases | 8 | −1.5% | 5 of 8 | −33.8% (Kilowatt Case) |
Gloves look worst, but three items is too few to call a category result, so I read that row as "all three gloves I track fell". Pistols and rifles are the more meaningful numbers: 25 items, 22 of them lower. The Desert Eagle Blaze (Factory New) going from $652.99 to $561.12 was the largest fall of any gun in the window.
Cases need a closer look. The Kilowatt Case's −33.8% is real in the sense that the snapshot recorded it, but the whole fall arrived in the final sample: its floor sat between $0.132 and $0.142 for eight straight snapshots, then read $0.09 on 22 August. Three weeks later, on 13 September, the feed had it back at $0.125. One low listing at the end of a window can set the headline for a whole category, which is why I do not quote a case "trend" from a single endpoint. The Chroma 3 Case, at the other end of the price range, held between $2.78 and $2.89 the entire time. The CS2 case prices guide tracks the case ladder live; at the latest refresh (13 October 2026) the Kilowatt Case's lowest listing was $0.08.
Price Level Mattered More Than Category
Sorting the same 56 items by their 31 July price gives a cleaner picture than sorting by category:
| Price on 31 July | Items | Median change | Items that fell |
|---|---|---|---|
| Under $50 | 18 | −4.8% | 14 |
| $50 to $1,000 | 27 | −6.7% | 26 |
| $1,000 and up | 11 | −2.3% | 7 |
The middle band fell hardest and most consistently: 26 of 27 items lower. The top band barely moved; the AWP Dragon Lore (Minimal Wear) went from $8,400.00 to $8,428.40 and the M4A4 Howl (Factory New) from $6,515.52 to $6,650.00. The cheap band falls in between on the median, but it contains the most extreme single readings in both directions, because a two-cent change on a 27-cent case is a 7% move.
My explanation for the middle band, which is opinion: four-figure items have few buyers but patient ones, and there is usually a standing offer not far below the cheapest listing. Mid-tier skins have many sellers who are relaxed about price, so when demand softens the floor simply drifts. I set out that reasoning, and its limits, in why CS2 skin prices drop. Treat it as an argument, not a measurement. My data shows the ordering, not the cause.
How Jumpy Each Category Was
Direction is half of a market report; the other half is how bumpy the path was. For each item I took the gap between its highest and lowest snapshot inside the window, then the median of that by category:
| Category | Median 22-day range (high vs low) |
|---|---|
| Cases | 21.2% |
| Pistols | 15.3% |
| Gloves | 10.5% |
| AWP | 9.9% |
| Rifles | 8.7% |
| Knives | 6.6% |
Knives were the calmest group I track, which surprised me given their prices. Cases were the jumpiest by a wide margin. The Recoil Case started and finished the window at $0.27 but touched $0.12 on 7 and 10 August and $0.29 on 19 August. That is a 141% range around a flat result. At those prices, percentages are the wrong unit; I look at cents instead.
The practical use of this table is setting alerts. Six of the eight knives stayed inside a 7.4% range for the whole window, so a 10% knife move deserves a look (the two that exceeded it, the Gut Knife and Butterfly Knife Dopplers, are exactly the ones I would have wanted flagged); a 10% move on a case was routine. If you run a tracker with one threshold for everything, cases will flood it with noise and knife moves will be the ones you miss. The CS2 skin price tracker guide explains why a single threshold fires constantly on cheap items and never on expensive ones.
Liquidity, Seen Through the Gap Between Marketplaces
I do not have trade volumes, so I cannot measure liquidity directly. What the feed does record is each marketplace's lowest asking price for the same item at the same moment, and the gap between venues is a rough stand-in for how efficiently an item trades. To keep it like-for-like I compare market.csgo against CSFloat, the two venues present for almost every item at every snapshot:
| Snapshot | Items | Median gap, market.csgo over CSFloat |
|---|---|---|
| 31 July | 56 | 12.3% |
| 16 August | 55 | 12.3% |
| 22 August | 55 | 13.3% |
By category on 22 August, cases had by far the tightest gap at 4.7%, while knives sat at 14.1%, AWP at 15.0%, rifles at 15.4% and pistols at 14.5%. The three gloves showed 20.3%, again too few items to lean on. Cases being tightest fits the idea that very cheap, heavily traded items get arbitraged quickly. Many sellers, near-identical goods, and a few cents of difference is enough to move buyers.
Where was the cheapest listing? On 22 August CSFloat held the floor for 34 of 56 items, Skinport for 13 and CS.MONEY for 9. If you are buying, that is a reason to check more than one venue: the cheapest venue changed from item to item, and the median gap of 13% is real money on anything over $50. The price checker shows every venue's live price side by side. The marketplace comparison covers the fees and cash-out rules that the asking prices leave out.
One caveat: these are asking prices. A wide gap can mean the dearer venue is simply slow, not that anyone pays its price. It is a liquidity hint, not a liquidity measurement.
The 13 August Cluster
On the 13 August snapshot three unrelated items printed their window low at the same time: the AWP Asiimov (Field-Tested) at $81.67 (from $108.02 on 31 July), the Glock-18 Water Elemental (Field-Tested) at $14.39 (from $18.67), and the Souvenir AWP Dragon Lore (Field-Tested) at $5,950. By 16 August the Asiimov was back at $104.69 and the Glock at $18.42.
I cannot tell whether that was a soft afternoon across several venues or my sampler catching a handful of mispriced listings at once, and nine data points will not settle it. I am recording it because a report that only describes the smooth parts of a dataset is misleading. If you see a spike in your own charts that reverses within one or two samples, suspect a single listing before a market event. The full walk-through of this cluster and the other artefacts is in CS2 skin price history.
My Autumn 2026 Watchlist
This is the list I wrote on 17 August of things I wanted to watch through the autumn. It is not a list of recommendations. I have kept the first and third columns exactly as published, because the October report grades them against those words. I have rewritten the middle column, which originally leaned on claims I have now removed.
| What I'm watching | Why | What would change my read |
|---|---|---|
| Discontinued case index | Whether the dearer, older cases keep holding while the cheap ones swing | A sustained break back below the Sep 2025 highs |
| FT AK-47 Redline price | One liquid mid-tier item as a barometer: $28.52 on 31 July, $26.84 on 22 August | Volume drying up even while price holds |
| Knife bid-ask spreads | A narrowing gap between venues would suggest buyers stepping in | Spreads widening into the autumn events |
| Any Valve drop-pool announcement | The one input that can override everything else on this list | N/A — it IS the change |
| Entry-level ($5-50) volume | Proxy for new-player demand | Two consecutive months of decline |
Two of these rows were badly chosen, and I would rather say so here than have you find out later. My data starts on 31 July 2026, so the first row's test against 2025 was never something I could run. And my feed records asking prices, not volume, so the second and fifth rows' tests cannot be checked either. The October report grades what it can and says so for the rest.
What This Report No Longer Claims
For transparency, this is what the original 17 August version said that is no longer on the page:
- A price spreadsheet on "400+ skins since 2023". The dataset behind this site starts on 31 July 2026 and covers 56 items. The report now uses only that.
- A 2024–2026 market history in "three acts", including a case index that "roughly tripled" and a specific AK-47 Redline run in summer 2025. None of it came from data published here.
- A "spring report" and a scorecard of its predictions. No spring report exists on this site.
- A category table of "roughly +10–20%" style bands against a 2025 peak. It is replaced by the measured 22-day table above.
- Market-size, owner-count and daily-volume figures attributed to a third-party report. I could not retrieve that report on 14 October 2026 to confirm the numbers, so they are gone rather than repeated unchecked.
- A personal selling anecdote, fee arithmetic and dated claims about late-2025 volatility that I had no record to support.
The result is a narrower report, and I think a more useful one. It describes three weeks of 56 items, and it describes them exactly. If you want the method behind the numbers, it is laid out in the investing hub. The live prices for every tracked item are on the CS2 skin prices homepage.
Frequently asked questions
How much did CS2 skin prices fall in August 2026?
Across the 56 items this site tracks, 47 fell between 31 July and 22 August 2026 and the median change was −5.6%. Items above $1,000 moved least (median −2.3%); items between $50 and $1,000 fell most consistently (26 of 27 lower).
What data does this cs2 skin market report use?
Only the site's own price snapshots: the lowest listing for 56 items across the marketplaces the price feed returned, recorded roughly every three days from 31 July 2026. It does not use trade volumes, market-size estimates or anyone else's index.
Why was the August 2026 report rewritten?
The first version included a long-term price history, a spring report and third-party market figures that could not be backed up by anything published here. On 14 October 2026 it was rebuilt from the site's own 22-day dataset, and the removed claims are listed on the page.